Read summarized version with
Picture the moment almost every CIO has lived through: budget season, and finance asks a version of “remind us what we’re getting for the cloud spend.” Everyone in the room knows migration happened. Nobody can point to metrics that prove it paid off. This isn’t a rare failure : McKinsey’s CloudSights research, drawn from interviews with cloud leaders at more than 80 enterprises, found that 40 percent report limited value from their cloud programs, and half of companies five-plus years into their cloud journey still haven’t crossed 20 percent adoption. Our own polling tells the same story from the other direction: “proven ROI” is the single most common reason Canada executives give for technology investment decisions and yet it’s rare to meet a business leader who feels their cloud spend is delivering it.
As an AWS Premier Tier Services Partner, this is the exact gap we spend most of our engagements closing. AWS has built an unusually mature set of frameworks, tools, and even a dedicated internal team around exactly this problem, Cloud Economics, and most organizations are using a fraction of what’s available. Below is a working framework for executive reporting that leans specifically on what AWS provides, with real numbers, real customer examples, and a practical build sequence.
Why “just track cost savings” quietly fails
The default instinct is to reduce cloud ROI to a single number: infrastructure spend, up or down. It’s the easiest metric to gather, and it’s also the fastest way to lose the argument, because it captures maybe a fifth of the actual value being created. AWS built its Cloud Value Framework specifically to correct for this, synthesizing input from 100+ enterprise customers and more than 1,500 public case studies into five value dimensions: cost savings, staff productivity, operational resilience, business agility, and sustainability. A 2025 IDC study commissioned by AWS quantified each one:
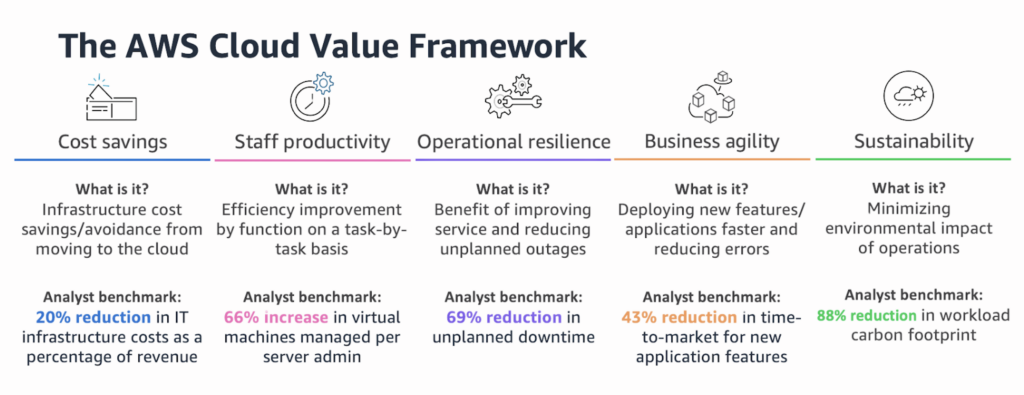
Now put faces on those categories, using our own work. We helped one client unify 18 databases on AWS at 45% lower cost, with analytics running 7x faster – a cost-savings story. For CASSEN Testing Laboratories, we built a multi-agent GenAI solution on Amazon Bedrock and OpenSearch that cut report generation from days to hours, 7x faster , while tripling chemical-marker analysis capacity (50 to 150+ per run) and cutting error rates from 10% to 3%; that’s productivity and agility in one engagement, freeing skilled lab staff from manual data processing to focus on client consulting. For an e-commerce client under regular DDoS pressure, our SOC 2 Type 2–certified operations delivered a 1.5-minute incident response and 3-minute resolution time — under 5 minutes end to end, zero downtime – a resilience story. And through our Graviton-based Cost Optimization Accelerator, clients see up to 40% lower infrastructure costs and 60% better performance per watt – a sustainability story as much as a cost one. Every one of these is a legitimate, board-worthy cloud ROI story from our own delivery record, and not one of them shows up if the only slide in the deck says “we spent 12% less on EC2 this year.”
The practical takeaway: your reporting package needs at least one metric from each of the five dimensions, even if cost stays the headline. A report built around cost alone is, structurally, only telling a fifth of the truth.
It’s worth starting here, because it changes how you should think about your own reporting practice. AWS Cloud Economics isn’t a marketing phrase – it’s a defined internal function with two focus areas: Business Value (BV), which helps a customer understand the impact they can expect from migrating to or building on AWS, and Cloud Financial Management (CFM), the ongoing operational discipline of managing spend once you’re live. AWS frames these as a “virtuous cycle”: BV is a point-in-time exercise (usually done pre-migration or before a major expansion), while CFM runs continuously for the life of the account.
AWS also maps this to a Cloud Buyer’s Journey , Discover, Evaluate, Buy, Use, Expand, Renew, with a different ROI question attached to each stage: “How can AWS add value in my industry context?” at Discover, “What differentiates AWS, how do I justify the move?” at Evaluate, “How do we accelerate value realization at the lowest possible cost?” at Use, and “What value have we realized, and what else can we accelerate?” at Expand/Renew. If your executive reporting doesn’t map cleanly to where a workload sits in this journey, that’s usually the first sign it’s using the wrong metrics for the audience.
Build the report around our own dashboard framework
McKinsey’s research on cloud transformation tracking identifies eight dashboard dimensions, each aimed at a different stakeholder and reviewed on a different cadence and one of the eight is explicitly named FinOps, sitting alongside Cost Performance, Application/Data Migration, and Security & Risk. This maps almost exactly onto how AWS structures its own CFM framework: See (measurement and accountability), Save (cost optimization), Plan (planning and forecasting), Run (cloud financial operations).
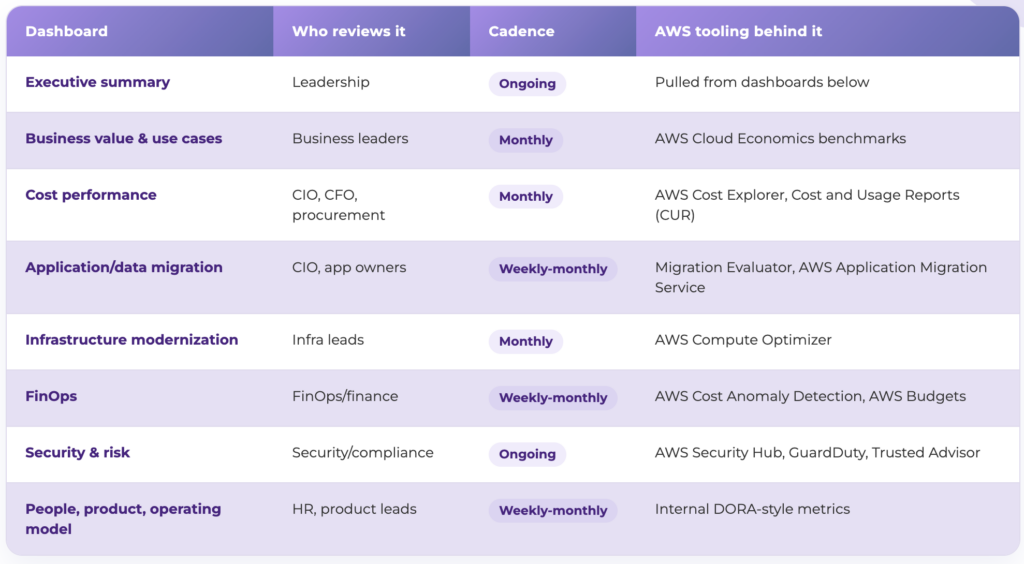
Two case studies of ours show what this actually buys you. A global automotive supplier, struggling for years to show financial progress on a multiyear cloud journey, put a monthly cost-performance dashboard in place and immediately discovered it had been missing a whole category of avoidable spend, decommissioning aging on-prem servers. Once the team started tracking and acting on it, they avoided more than $50,000 in capital expenditure. In another case, a pharmaceutical company consolidating scattered, inconsistent progress reports into one automated dashboard found its migration tracking had never accounted for “orphan servers” left running after the app that used them had already moved.
The metrics, organized by what they actually prove, and the AWS service behind each
1. Cost and budget control
We recommend starting with Measurement and Accountability – the discipline of implementing an account structure and tagging dictionary so cost and usage map cleanly to workloads and org structure. The headline metric is Cloud Allocation % – the percentage of total spend mapped to a specific, accountable business owner. AWS’s own benchmark: organizations at “Walk” maturity typically allocate 70%+ of spend to responsible owners; “Run”-maturity organizations hit 90%+ using direct consumption measures (tags, API-call attribution) rather than blunt proxies like headcount.
The native AWS toolchain for this layer is deep and worth naming explicitly, because most customers use only one or two pieces of it:
- AWS Cost Explorer -the default lens for cost and usage reporting, and the source of right-sizing and Reserved Instance/Savings Plan recommendations.
- AWS Cost Anomaly Detection and AWS Budgets – catch unexpected overages before the monthly bill lands rather than after.
- AWS Cost and Usage Reports (CUR), queried via Amazon Athena – for stakeholders who need granular, custom reporting beyond what Cost Explorer’s UI supports.
- AWS Cost Categories and AWS Billing and Cost Management Conductor – for formal showback/chargeback allocation once a tagging schema matures.
- AWS Cloud Intelligence Dashboards (CID) – a pre-built QuickSight-based dashboard layer AWS provides specifically to accelerate exactly the kind of executive cost-performance reporting this article is about.
- AWS Compute Optimizer, AWS Trusted Advisor, and Amazon S3 Analytics – for identifying rightsizing, idle resource, and storage-tiering opportunities that feed the “Save” pillar.
- Savings Plans and Reserved Instances – AWS’s primary rate-optimization levers, purchasable without any resource modification, guided by Cost Explorer’s commitment recommendations.
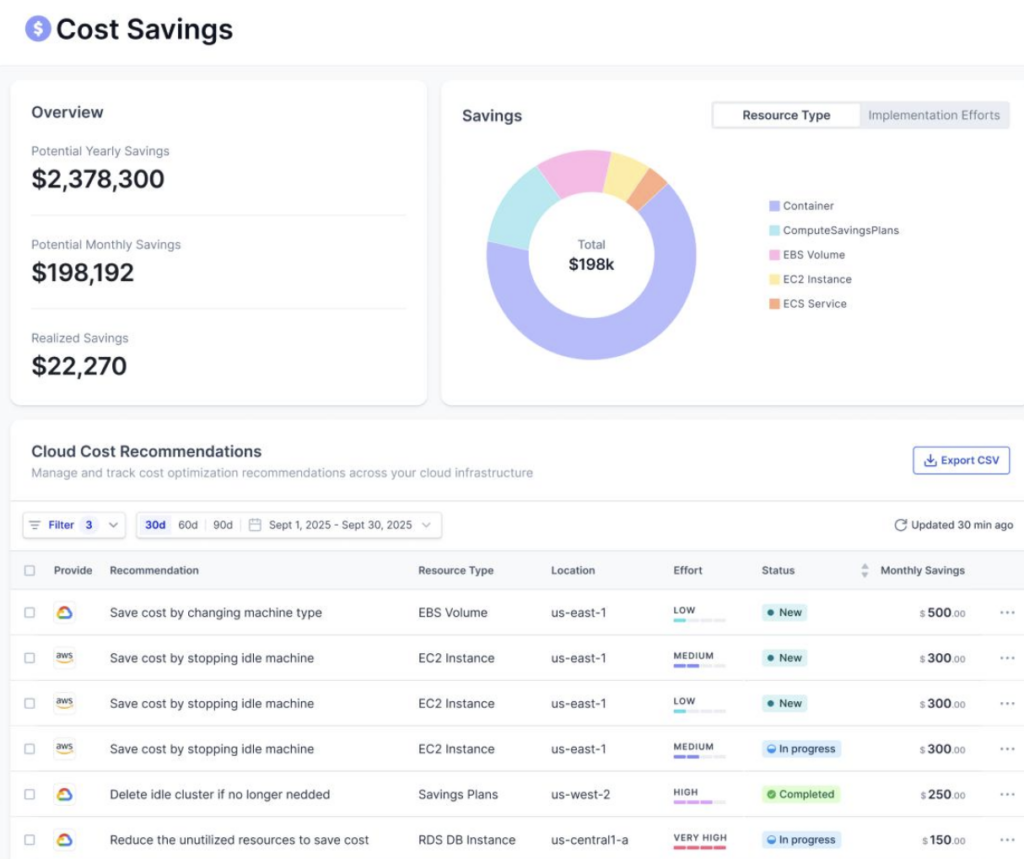
Real customer numbers from using this stack with discipline: one of our clients increased cost visibility enough to cut costs by 40% in six months. Another saved 15% of cloud infrastructure cost in 50 days. Constantly we suggested our clients using AWS Cloud Financial Management services to govern costs proactively.
Recent AWS Research survey of 1,000 IT decision-makers found 95% agree cloud reduces TCO versus on-prem equivalents, and that 72% of current public cloud users plan to increase spending in the coming year, more than any other technology category. The more important finding: longer-term, disciplined cloud users see it compound. Over 60% of organizations with 4+ years of cloud usage report unit cost savings greater than 60%.
2. Unit economics
This’s where a lot of executive reporting quietly falls apart: leadership wants to know “is this efficient,” and dollar totals can’t answer that on their own, because total spend rises every time the business grows. Unit economics fixes this by pairing spend with a denominator- usage, output, or a business outcome.
The FinOps Foundation splits unit metrics into two tiers: resource-efficiency metrics – cost per GB stored, cost per vCPU, cost per token, cost per API call, that engineers control directly and can surface using AWS’s own per-service billing granularity (AWS’s per-second billing on Compute and several database services makes this more precise than hourly-billed alternatives); and business unit metrics – cost per transaction, cost per customer, cost to serve, that require cross-functional agreement but are what lets Finance or Product actually act.
AWS CAF’s Cloud Financial Management capability builds this into a formal maturity model matching Start / Advance / Excel stages: at Start, teams model cost with the AWS Pricing Calculator and rely on historical trend-based forecasting; at Advance, a formal tagging schema is published jointly by technology, finance, business, and security stakeholders, and AWS Cost Categories are used for showback; at Excel, unit metrics like cost per Amazon EC2 hour or cost per business transaction are tracked continuously as usage grows, with a single-threaded owner (an individual, a CBO, or a CFM/FinOps team) accountable for the whole program.
3. Business value and agility
This is the category most likely to be missing from a technical team’s report and the one most likely to actually move a board. Metrics: speed to market, % of customers using new cloud-enabled features, revenue attributable to cloud-enabled use cases, time to insight.
Businesses pairing cloud adoption with better analytics report being able to increase data available for analytics by 35%, cut time to insight by 34%, and the number that lands hardest with a CFO : see a 28% revenue increase tied to faster decision-making. Governance maturity matters here too: our recent survey found teams with executive (VP/SVP/C-suite) sponsorship carry 2–4x more influence over technology selection than Director-only teams – cloud service selection influence jumps to 53%, cloud provider selection from to 47%. Framing metrics in business-value language, and putting them in front of an executive sponsor, is how a reporting function earns a literal seat in future AWS spend decisions.
4. Operational resilience and security
AWS customers report an average 45% reduction in security-related incidents per month and a 39% reduction in mean time to detect security events after migration, driven substantially by native services: AWS Security Hub, Amazon GuardDuty, Amazon Inspector, AWS Config, and AWS CloudTrail, all part of the Risk Management capability in the AWS Cloud Adoption Framework (CAF). Atlassian’s specific case: 99.99% uptime, 40% latency reduction. AWS CAF’s governance guidance recommends these move from manually operated controls (Start) to continuous, automated compliance monitoring via AWS Control Tower and policy-as-code (Excel) as maturity increases.
5. AI spend – the fastest-growing blind spot for your metrics in 2026
The FinOps Foundation’s 2026 survey found 98% of organizations now manage AI spend, up from just 31% two years ago – faster than any other technology category has ramped. Many are being asked to self-fund AI investment through optimization savings elsewhere, adding pressure to traditional cost work even as teams report diminishing returns there.
Our own guidance is to treat AI spend with the same governance discipline already applied to public cloud rather than as a separate silo – “another bucket of spend that requires the same discipline and governance as any other technology,” as one financial services practitioner put it. Starting metrics: cost per token / cost per API call for managed AI services (AWS explicitly calls out SageMaker as a reference point), progressing toward cost per assist or cost per case deflected, plus a time-to-breakeven comparison against the labor cost of the same task.
A practical build sequence for your metrics, using what AWS already gives you
- Turn on AWS Cost Explorer, Budgets, and Cost Anomaly Detection on day one – they’re included, and skipping them is the single most common gap we see in partner engagements.
- Get allocation right before anything else. Tag resources to owners; target AWS’s 70% (Walk) / 90%+ (Run) allocation benchmarks explicitly in your first executive readout, and state which percentage of the picture is trustworthy versus estimated.
- Deploy AWS Cloud Intelligence Dashboards rather than building executive reporting from scratch – it’s purpose-built by AWS for exactly this use case and dramatically shortens time-to-first-dashboard.
- Pick one unit metric per major workload and watch its trend for at least two quarters before drawing conclusions.
- Engage AWS Migration Evaluator or the AWS Cloud Economics team (available through your account team and something we help clients access directly as a Premier Partner) when building or refreshing a formal business case rather than estimating TCO manually.
- Name an owner and cadence for every metric, following AWS CAF’s single-threaded-owner model, before it goes on the dashboard.
- Report AI spend even before you can report AI value. Visibility now buys credibility later.
The one-line test
Ask: would this number change what a non-technical leader decides to do next? Total AWS spend, alone, rarely does. “Cost per transaction is down 18% this quarter while transaction volume is up 40%, using AWS Cost Explorer’s own commitment recommendations to get there” almost always does – it reframes the same underlying data as a story about efficiency scaling with growth, not a bill going up. That reframing, backed by the depth of your cloud’s tooling and its Partner network to implement it correctly, is what separates cloud reporting that gets budget renewed from cloud reporting that gets questioned every quarter.
Where Dedicatted fits in your metrics evaluation
Dedicatted has been building and running infrastructure like this for over 9 years, with around 80 engineers and 140+ projects delivered. As an AWS Premier Tier Services Partner and a top 2% global AWS partner, we run these dashboards for clients every day, not just design them on a slide. We’re SOC 2 and ISO 27001 certified, so the cost and usage data feeding your reports is handled the same way we’d handle any other regulated system, with the audit trail to prove it.
The point of a real FinOps practice, in plain terms, is that someone owns the numbers so the business doesn’t have to chase them down every quarter. You still get full visibility: allocation tracked back to a named owner, unit economics that actually hold up over time instead of a spend total that just goes up, and a monthly reporting cadence built around the dashboard your stakeholders need, not a generic export from the billing console. The reporting doesn’t disappear into a slide deck nobody opens again. It becomes the thing your CFO actually checks against.
Curious what this looks like for your own cloud spend? Our cloud and DevOps team can walk through where your current reporting has blind spots, and what it would take to close them.